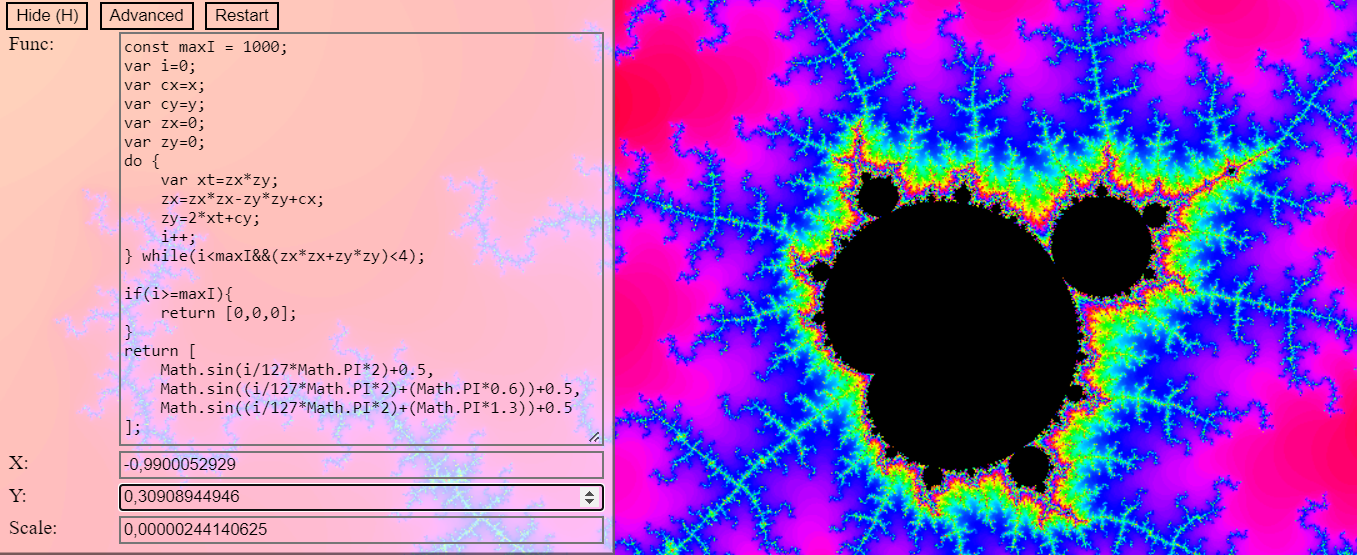
Codemaker's Plotter is my JavaScript real-time math plotting project.
 It takes a JavaScript function as input, and plots the output of that function on the screen. It does this by executing the function for every pixel on the screen. The reason this can be done in real time is because of a dynamic resolution and because it uses multiple threads to render everything.
Sadly, it can't make use of the GPU because the functions are in JavaSctipt, and compiling that to webGL isn't really practical. JS was a bit of an arbritary choice, bit it is fast enough like this.
By default, the function will draw the Mandelbort set. But this plotter is capable of drawing any f(x,y) that outputs a color, number or boolean. Try this for example:
return x**2 + y**2 < 1 && x**2 > y/2;
This function first creates a white circle with radius of 1, and then takes a bite out of it in the shape of the quadratic function y/2 = x^2.
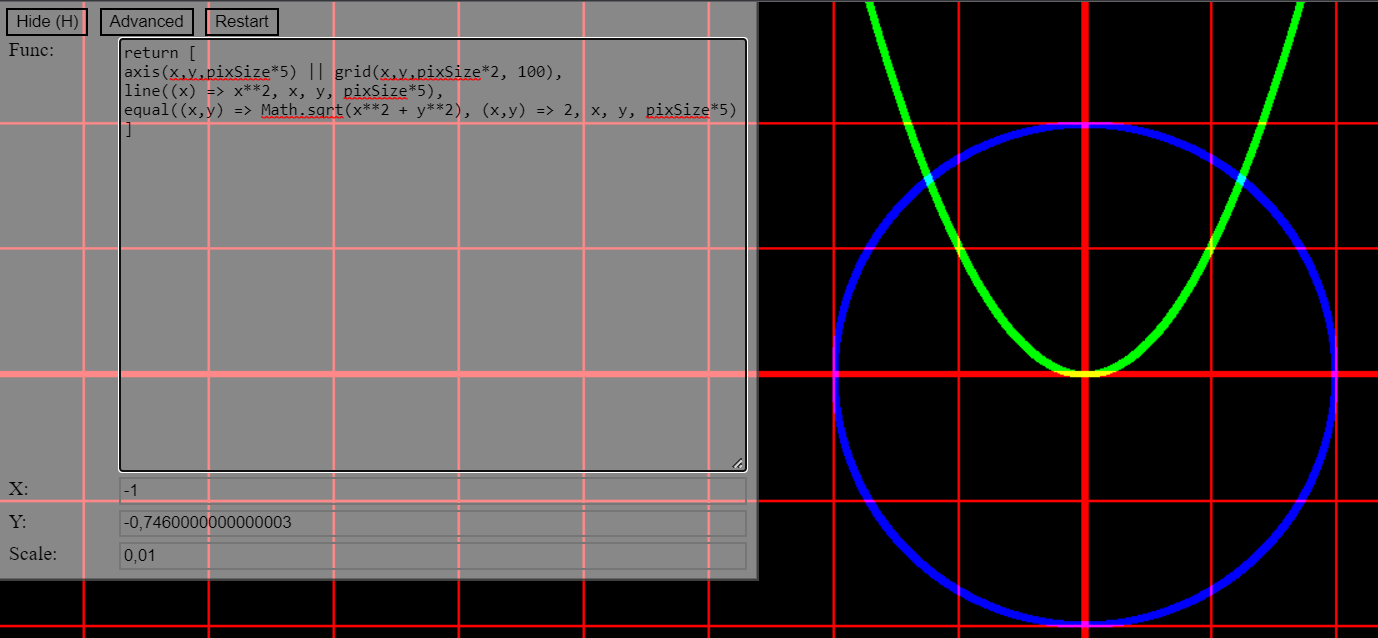
But I also added some utility functions, and you can return an RGB array of booleans or numbers to create color. This last example demonstrates this:
                    return [

                        axis(x,y,pixSize*5) || grid(x,y,pixSize*2, 100), // create a thick axis, with thinner lines in red.

                        line((x) => x**2, x, y, pixSize*5), // draw a line where y = x**2 in green.

                        equal((x,y) => Math.sqrt(x**2 + y**2), (x,y) => 2, x, y, pixSize*5) // draw a line where the distance from the origin is equal to 2 in blue.

                    ];
 I still want to add axis as a defualt overlay, instead of a part of the input function. That way it is also easier to know what location you are looking at, and it will probably also be faster than the current in-function approach.
